
Get started with Grafana
What you'll build
A Grafana dashboard with a live Prometheus visualization — from a blank dashboard to a working panel querying platform metrics. By the end you'll know how to navigate Grafana, use the Metrics Explorer, and run your first query.
Before you begin
- A SmoothGlue platform with Ground Control enabled
- Console access with SRE or OrgAdmin role
Sign in to Grafana
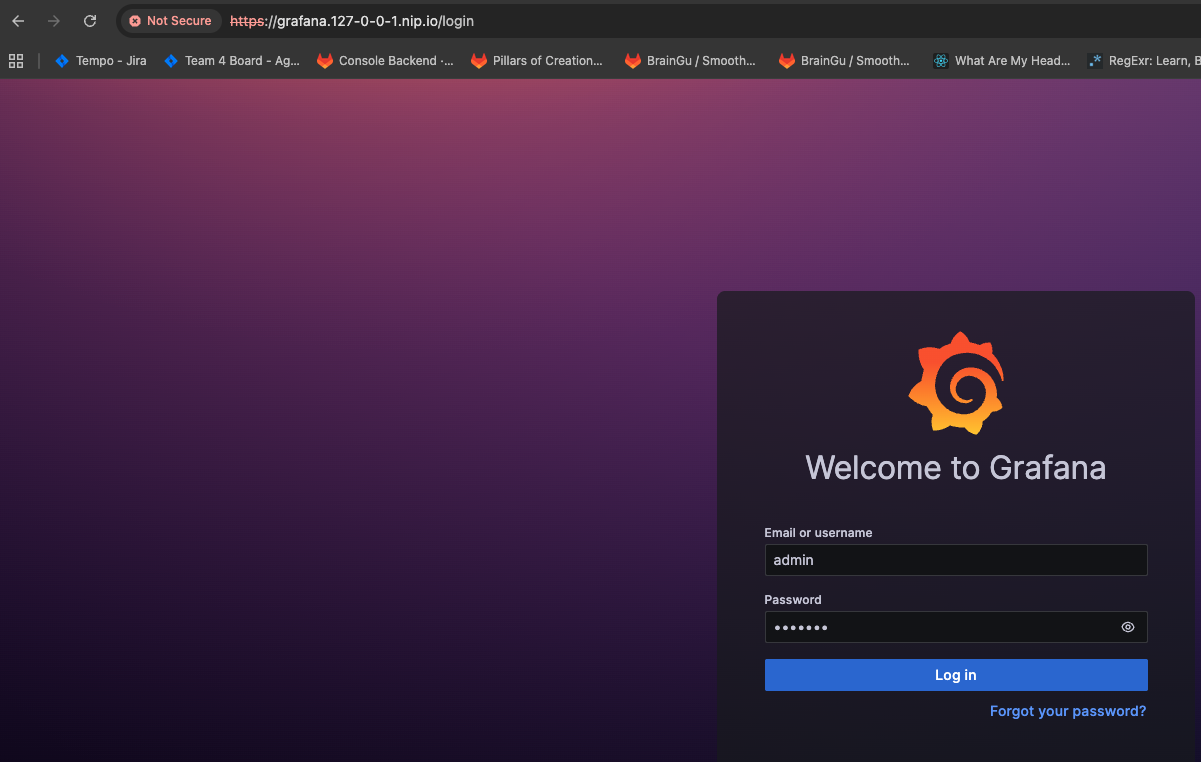
Navigate to https://grafana.<your-domain>/login.
On a SmoothGlue platform, Grafana uses Keycloak SSO. Click Log in and authenticate with your platform SSO credentials — same username and password you use for the Console and GitLab. You will not see a separate Grafana username/password prompt on production platforms.
Navigate to Dashboards
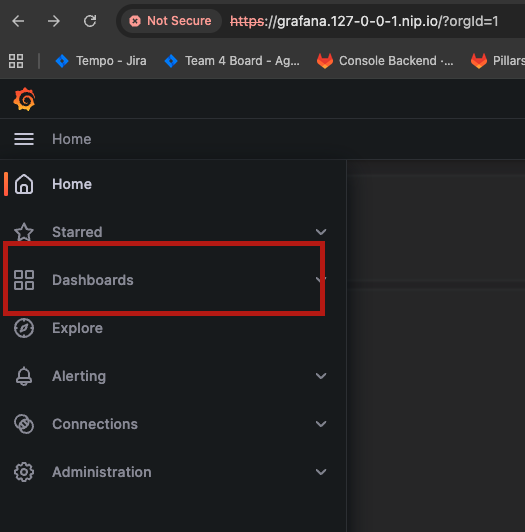
In the left sidebar, click Dashboards.
Create a new Dashboard
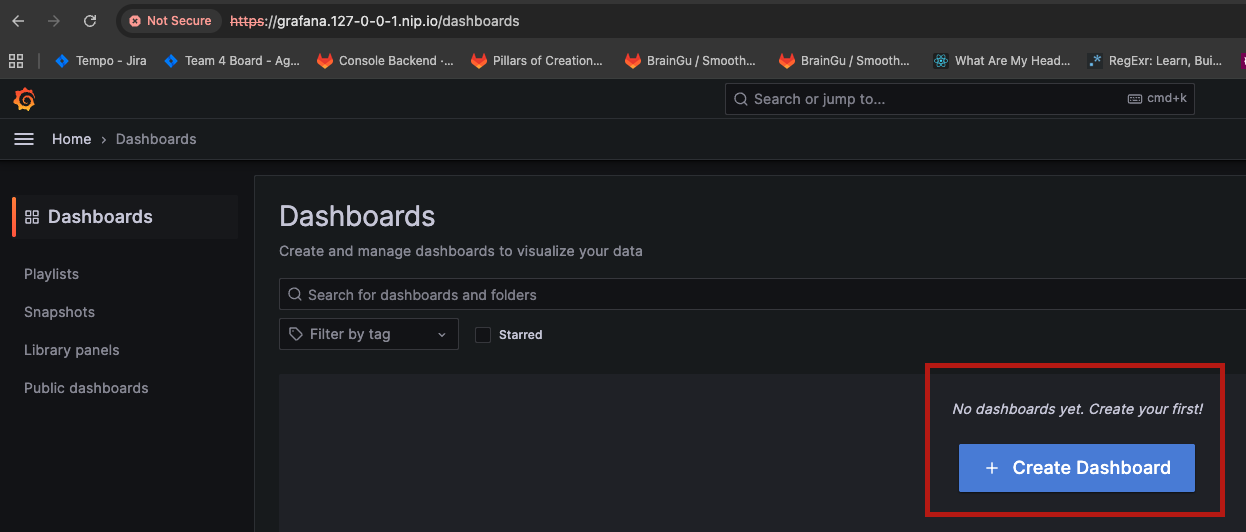
Click + Create Dashboard.
Add a visualization
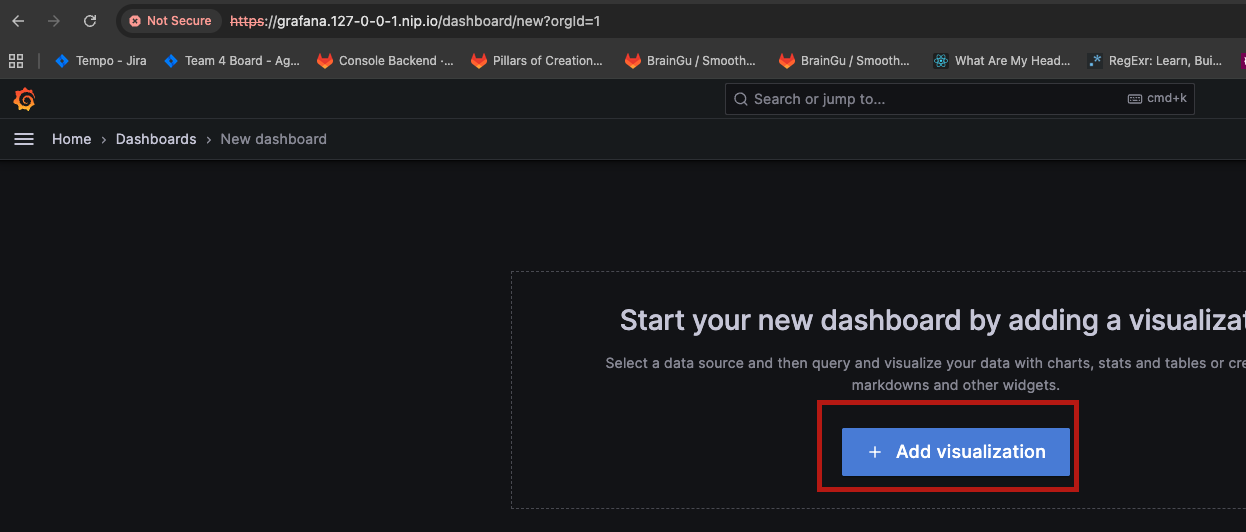
On the new dashboard, click + Add visualization.
Select a data source
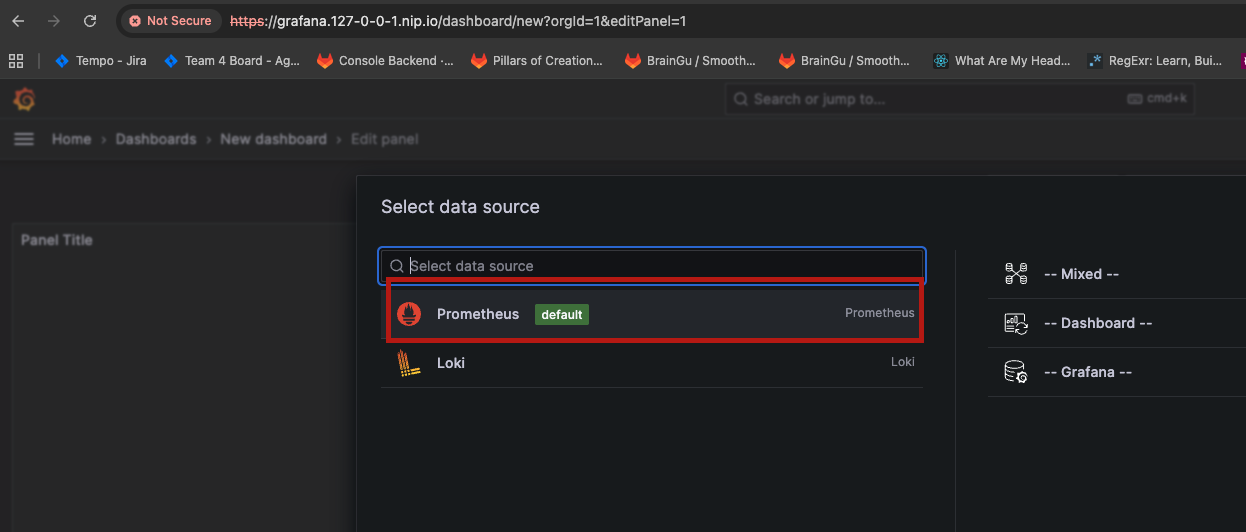
Select Prometheus from the data source list. Prometheus is pre-configured as the default data source — it's collecting metrics from all platform components already.
You'll also see Loki in this list — that's the log data source. For metrics, use Prometheus.
Open the Metrics Explorer
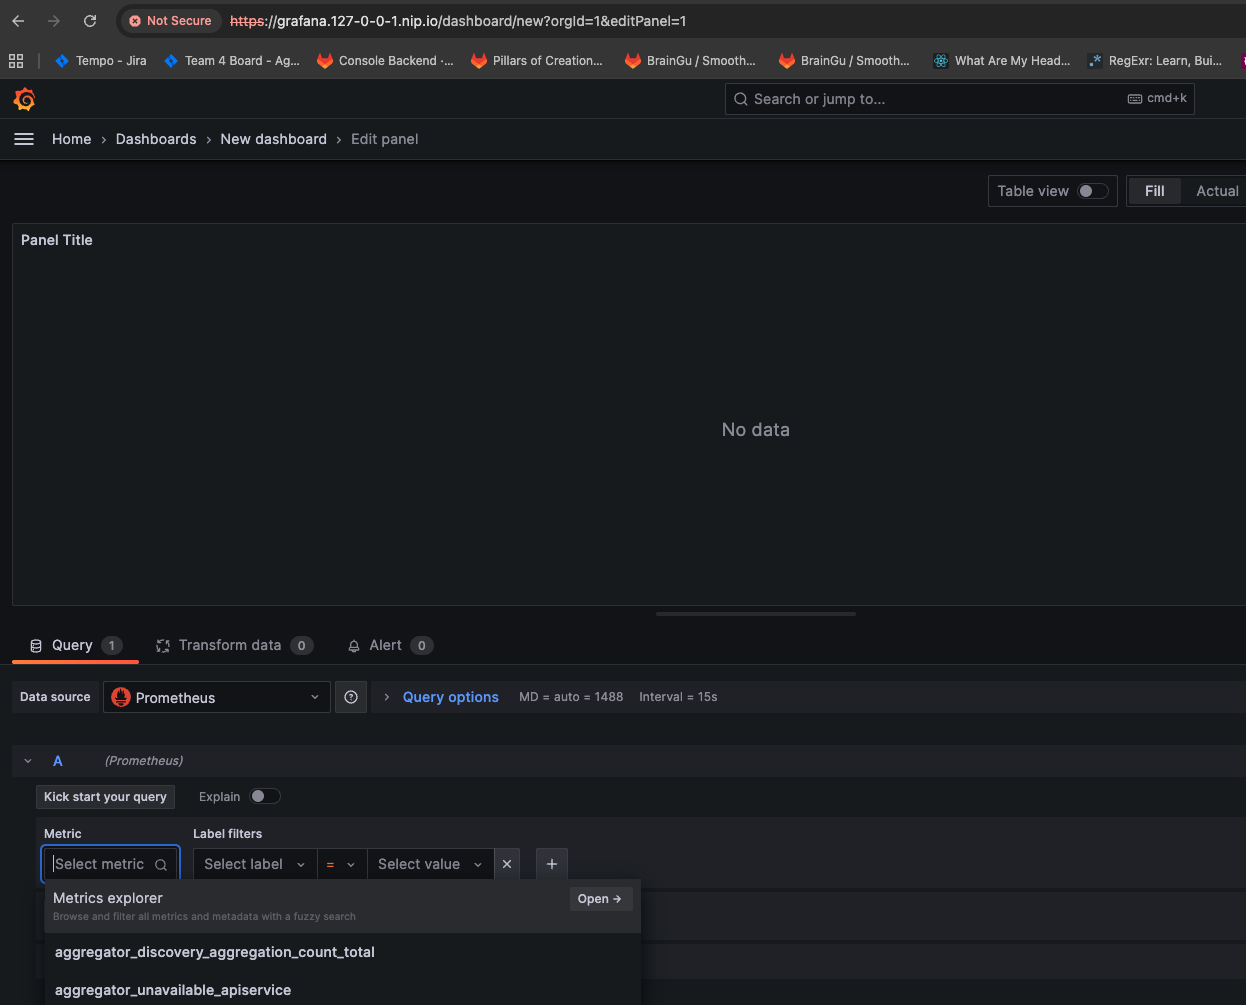
In the query editor, click into the Metric field. A dropdown appears. Click Metrics explorer → to open a searchable list of every metric Prometheus is collecting.
Find and select a metric
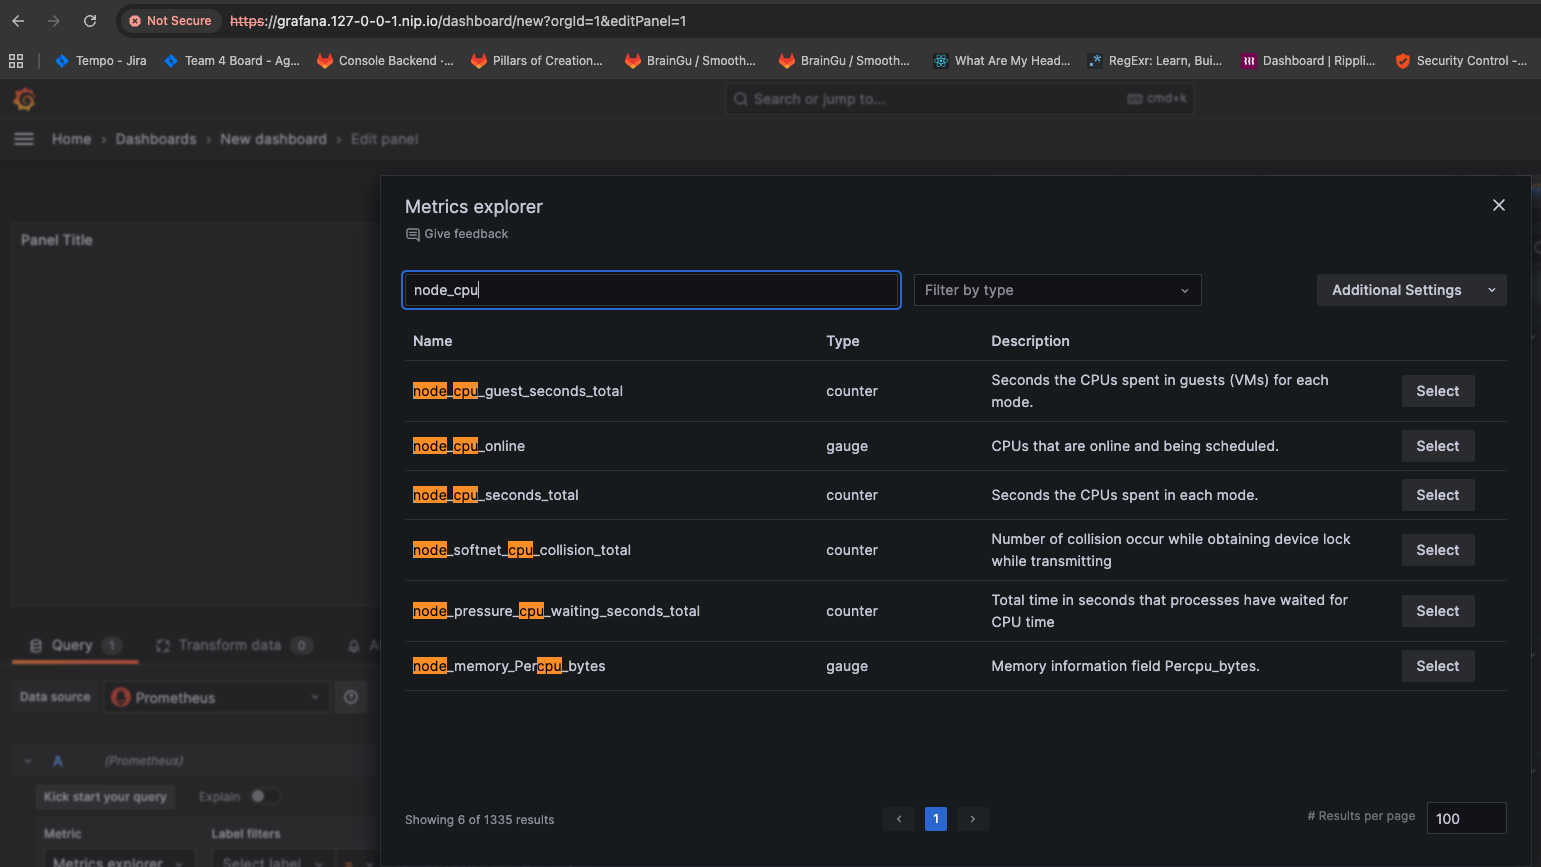
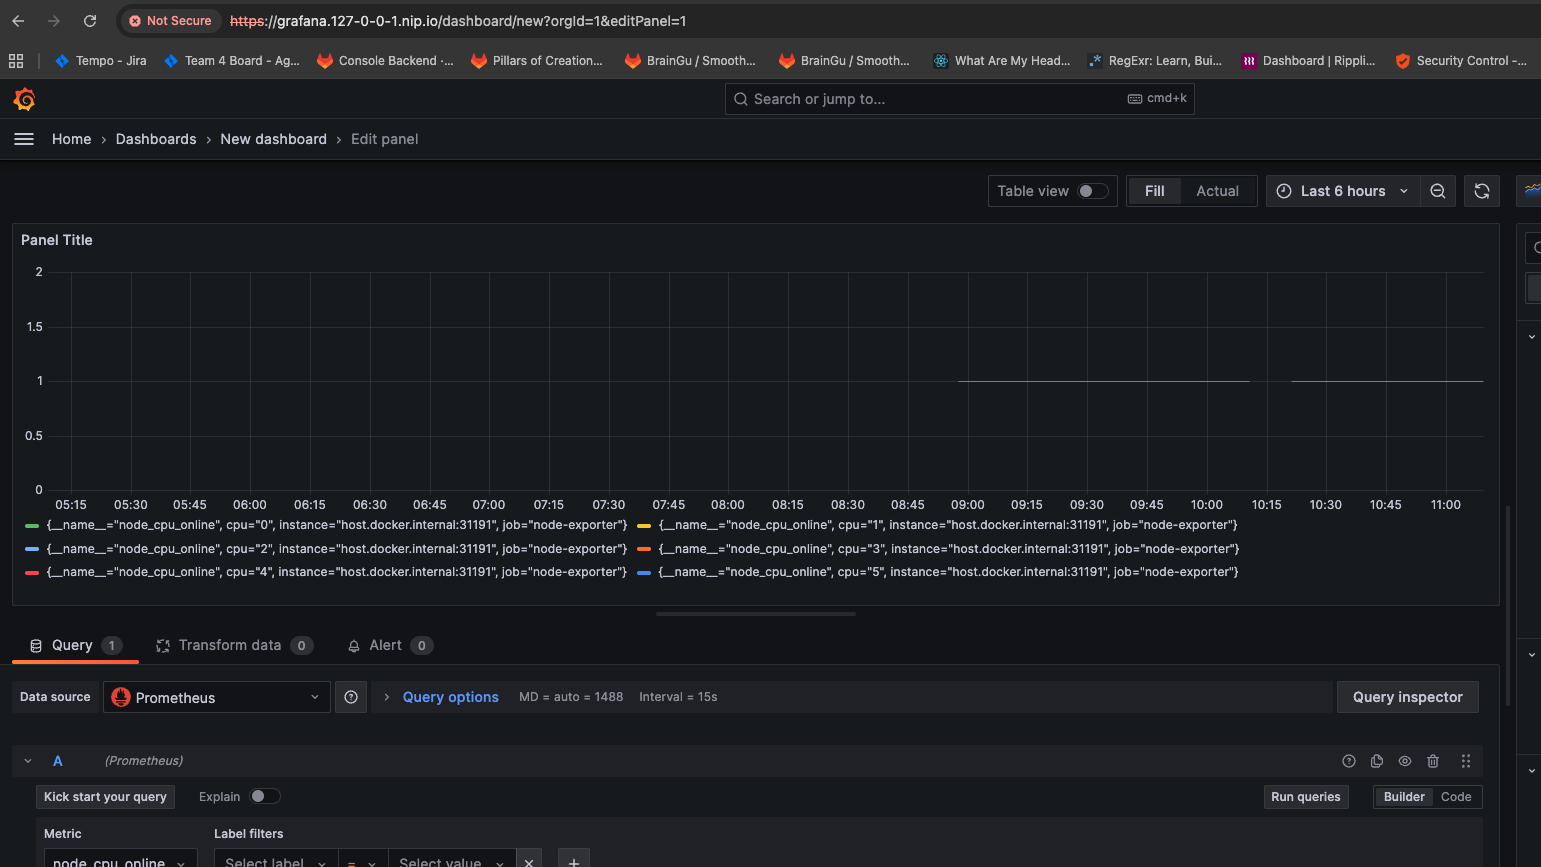
Search for node_cpu to see CPU-related node exporter metrics. Select node_cpu_online — this shows the number of CPUs that are online and being scheduled across your platform nodes.
Run the query
Click Run queries to execute the query against Prometheus.
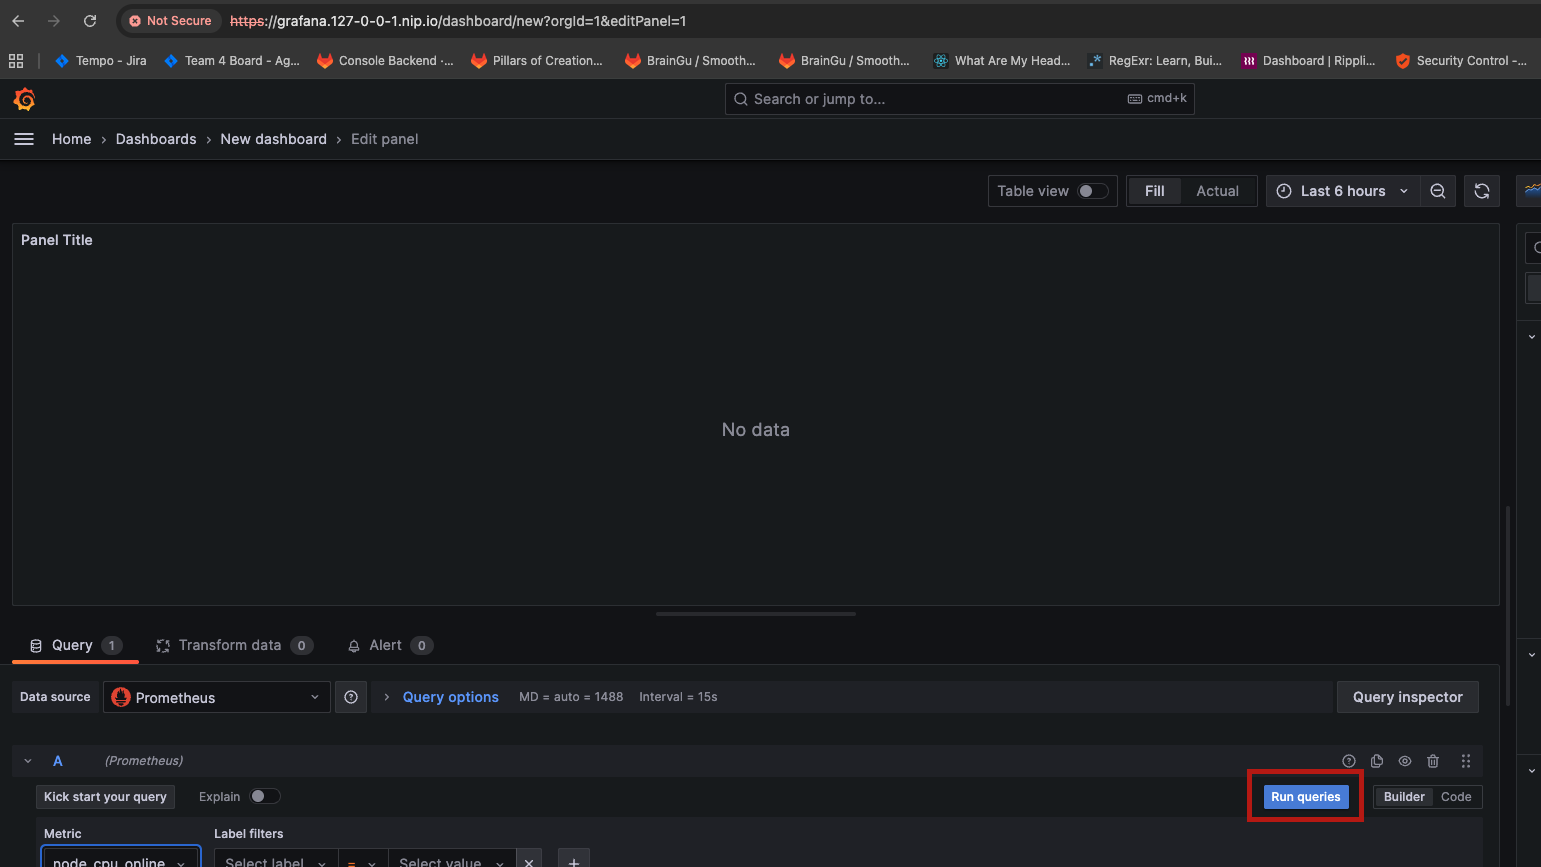
Grafana renders a time-series panel showing one line per CPU core across all scraped nodes.
What's next
You've run your first Prometheus query in Grafana. From here you can:
- Name and save the dashboard — click the save icon (top right) to persist it
- Add more panels — click + Add in the dashboard toolbar to add another visualization
- Explore your app's metrics — if your app exposes a
/metricsendpoint with the correct Kubernetes annotations, its metrics are already in Prometheus. Search for your app's metric names in the Metrics Explorer
Learn more: